The vNN Method
The vNN method rests on the premise that compounds with similar structures have similar
activities. It is therefore reasonable to weight the contributions of neighbors so that
closer neighbors contribute more to the predicted value. The vNN method calculates the
similarity distance between molecules in terms of their structure, and uses a distance
threshold to define a domain of applicability (i.e., all nearest neighbors that meet a
minimum similarity threshold constraint). This applicability domain ensures that the
predictions generated are reliable. vNN models can be built within minutes and require
no re-training when new assay information becomes available—an important feature when keeping
quantitative structure–activity relationship (QSAR) models up-to-date to maintain their
performance levels. The performance characteristics of vNN-based models are comparable,
and often superior to, those of other more elaborate model constructs.1,2,3,4
One of the most widely used measures of the similarity distance between two small
molecules is the Tanimoto distance, d, which is defined as:
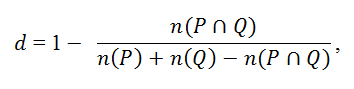
where η(P∩Q) is the number of features common to molecules p and q, and η(P) and η(Q) are the total numbers of features for molecules p and q, respectively. The predicted biological activity y is then given by a weighted average across structurally similar neighbors:
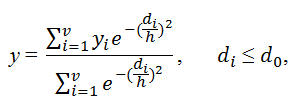
where di denotes the Tanimoto distance between a query molecule for which a
prediction is made and a molecule i of the training set; d0 is a Tanimoto-distance
threshold, beyond which two molecules are no longer considered to be sufficiently similar to
be included in the average; yi is the experimentally measured activity of molecule i;
v denotes the total number of molecules in the training set that satisfies the condition
di≤d0; and h is a smoothing factor, which dampens the distance penalty. The
values of h and d0 are determined from cross-validation studies. To identify
structurally similar compounds, we used Accelrys extended-connectivity fingerprints with a
diameter of four chemical bonds (ECFP4),5 which have
previously been reported to show good overall performance.4,6,7
Model Validation
We use the 10-fold cross-validation (CV) procedure to validate new models and to determine
the values of the smoothing factor h and Tanimoto distance d0. In this procedure, we
randomly divided the data into 10 sets, and used 9 to develop the model and the 10th to validate
it. We repeated this process 10 times, leaving each set of molecules out once.
When building new models, we reported averages of the 10-fold CV as the performance measures.
Performance Measures
We use the following metrics to assess model performance. (1) sensitivity measures a
model’s ability to correctly detect true positives, (2) specificity measures a model’s ability to
detect true negatives, (3) accuracy measures a model’s ability to make correct predictions , and
(4) kappa compares the probability of correct predictions to the probability of correct predictions
by chance (its value ranges from +1 (perfect agreement between model prediction and experiment) to –1
(complete disagreement), with 0 indicating no agreement beyond that expected by chance).
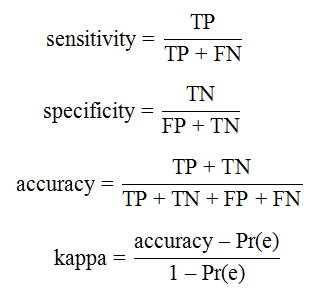
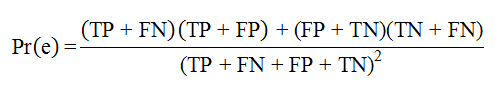
here TP, TN, FP, and FN denote the numbers of true positives, true negatives, false positives, and false negatives, respectively. Kappa is a metric for assessing the quality of binary classifiers. Pr(e) is an estimate of the probability of a correct prediction by chance. It is calculated as:
We also calculated the coverage, which is the proportion of test molecules with at least one nearest
neighbor that meets the similarity criterion. The coverage is a measure of how many test compounds
are within the applicability domain of a prediction model.
References
- Liu, R., G. Tawa, and A. Wallqvist. Locally weighted learning methods for predicting dose-dependent toxicity with application to the human maximum recommended daily dose. Chemical Research in Toxicology. 2012; 25(10):2216-2226.
- Liu, R., and A. Wallqvist. Merging applicability domains for in silico assessment of chemical mutagenicity. Journal of Chemical Information and Modeling. 2014; 54(3):793-800.
- Liu, R., P. Schyman, and A. Wallqvist. Critically assessing the predictive power of QSAR models for human liver microsomal stability. Journal of Chemical Information and Modeling. 2015; 55(8):1566-1575.
- Schyman, P., R. Liu, and A. Wallqvist. Using the variable-nearest neighbor method to identify P-glycoprotein substrates and inhibitors. ACS Omega. 2016; 1(5):923-929.
- Rogers, D., and M. Hahn. Extended-connectivity fingerprints. Journal of Chemical Information and Modeling. 2010; 50(5):742-754.
- Hert, J., P. Willett, D. Wilton, P. Acklin, K. Azzaoui, E. Jacoby, and A. Schuffenhauer. Comparison of topological descriptors for similarity-based virtual screening using multiple bioactive reference structures. Organic and Biomolecular Chemistry. 2004; 2:3256-3266.
- Duan, J., S. Dixon, J. Lowrie, and W. Sherman. Analysis and comparison of 2D fingerprints: Insights into database screening performance using eight fingerprint methods. 2010; 29(2):157-170.